Describler [2016-2017]
- Doug Schepers.
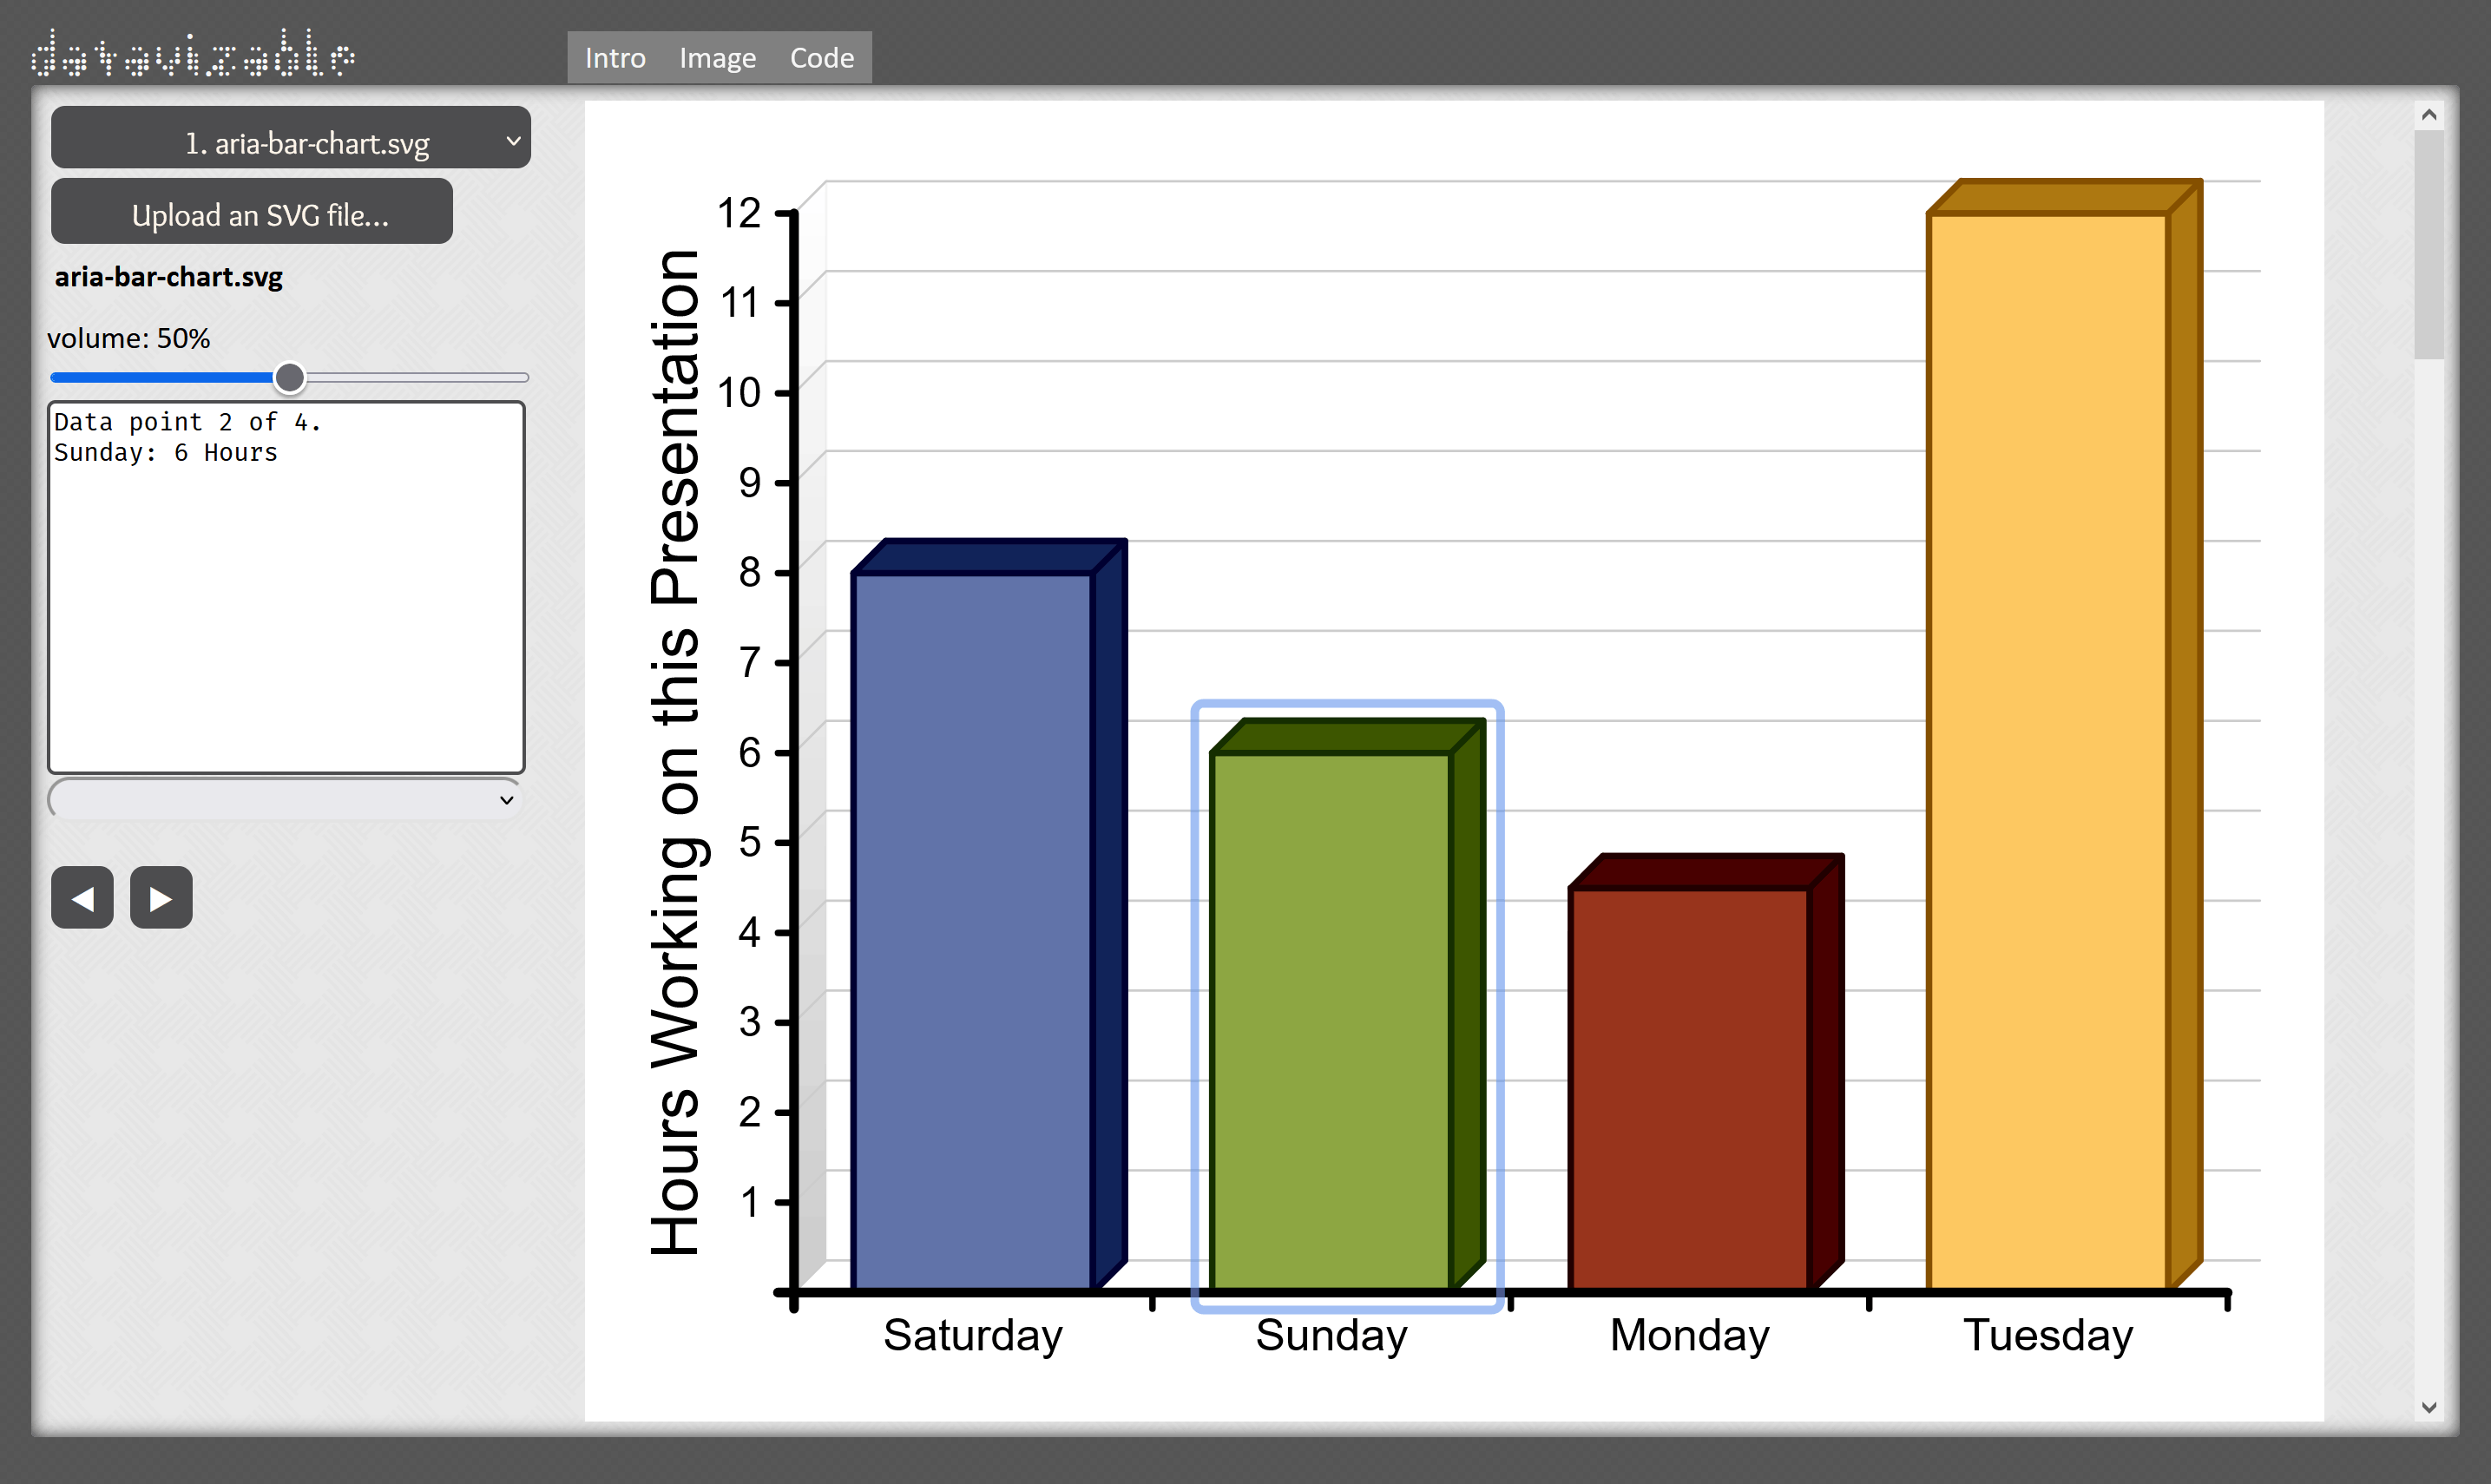
- Proof-of-concept accessible chart reader with built-in speech output.
- Custom ARIA roles and properties on SVG objects.
- Hand-edited markup for SVG examples.
- Somewhat buggy, not screen-reader friendly.
describler.com.